
At the Bybit cryptocurrency exchange, you can use indicators in chart analysis with many tools such as TradingView, so we will explain how to use them and their functions. We also use something called TradingView for charts. Traders should refer to these two things, as they will need to know them when trading from now on.
Trading View
Bybit trading charts are powered by Trading View. This system is often used not only for virtual currencies but also for stocks and FX, and is known as a multi-functional chart. You can change the color of the candlesticks and change the background color, so you can change the look to your liking. You can also change details such as adding color to the current value of the indicator to emphasize it, or changing the color and thickness of the indicator line.
What is an indicator?
Indicators are technical indicators used to recognize, predict, and judge market trends. It is often difficult to understand the current market situation just by looking at the chart. You can visualize this by using indicators as training wheels. Bybit exchange has a large number of indicators that you can check and analyze market information data. This time, I will introduce Trading View as a list. It is also available as an app.
Features of Trading View
Some overseas crypto asset exchanges use the latest Trading View, which has the following functions and is a popular and convenient system that is used in a variety of trades such as foreign exchange, stocks, and virtual currencies. However, Trading View has a free version and a paid version, so there are things you can and cannot do with each version. For more information, please contact support on the official website. Basically, you can see the passage of time and positions on charts, making it excellent for analysis. It’s perfect if you check it along with the news.
View multiple instruments and symbols
TradingView allows you to view charts of multiple financial instruments and symbols on one screen. For example, stocks and FX, FX and cryptocurrencies, etc. can display different products. In financial markets, different products can influence each other. It is a system that can detect this in advance.
Over 100 indicators
TradingView has over 100 indicators by default. And not only that, the public library publishes user-designed strategies and indicators, and other users can use the published indicators. All of these add up to over 100,000.
create indicator
As mentioned above, users can also create their own indicators as individuals. If you have programming knowledge, you can use TradingView’s script Pine to create indicators from the icon cursor. The platform also allows you to easily set chart properties from the toolbar. It is easier to predict two things, such as lows and highs, and respond accordingly.
Customizing the chart screen
By combining 100 types of indicators, over 50 types of drawing tools, and 12 types of charts, you can set up your own chart screen. There are scales such as moving averages and Bollinger bands, so you can select many important ones and place them on the graph. You can wait while watching the price movement until the limit price without buying or selling poorly. You can also reset it.
Alert function
It also has an “alert function” that can send notifications to your smartphone or PC when triggered by indicators or trend line values. You can set 12 types of alert conditions, such as alert frequency, expiration date, and notification format such as pop-up or email. You can trade after understanding the indicators to see if the symbol has an upward or downward trend. You can simply set it according to the trend, such as long-term or short-term.

TradingView and how to work with indicators
To actually operate TradingView and indicators, you must first log in to the administration and view the chart screen. You will need to create an account, so please refer to the article below. Orders and operations can be done using a browser or smartphone. It is equipped with signals such as moving average lines and can be used together, making it easy to understand and very convenient.

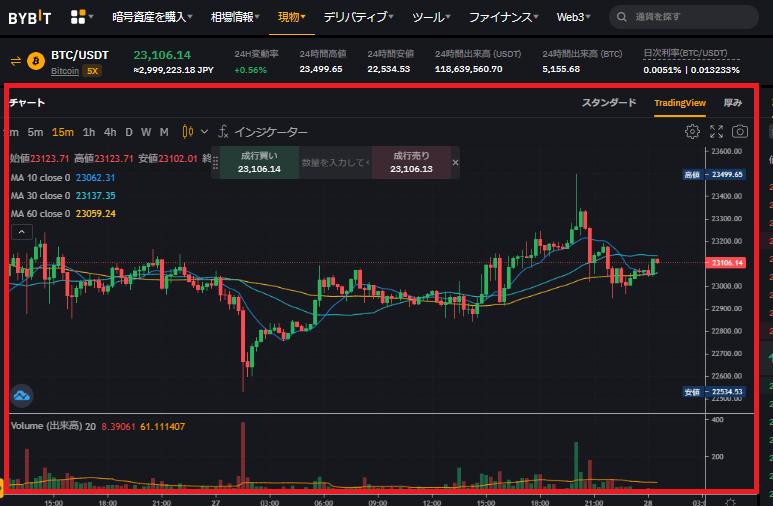
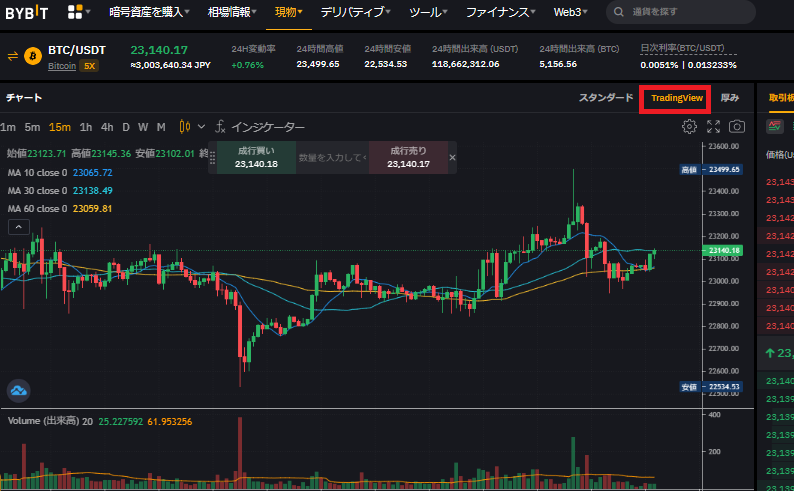
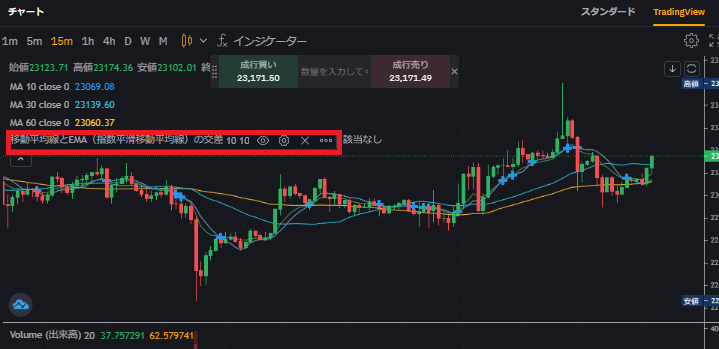
When you log in, let’s select any stock and display it on the chart screen. By default, it is a standard chart, but you can switch it by clicking “TradingView” in the red frame.
Indicator settings can be added by clicking “Indicators” above the chart. There are many types of indicators and you can add your favorite ones.
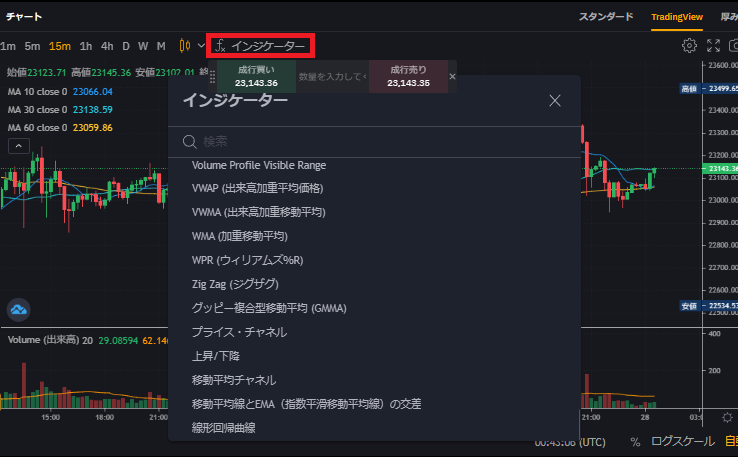
Added indicators can also change their settings. The eye mark can be used to hide or display the indicator, and the gear mark can change the style, color and size of the line. The × mark is the deletion of the indicator display. Other detailed settings can be made for the “…” mark.


コメント